Final Crypto Tool Charts are the platform’s top features for users seeking an edge on their trading positions. These live charts provide traders with well-sorted and visualized data on the latest market performance, trends and directions. The platform updates information up to each minute to ensure traders make precisely informed decisions for growing their portfolios.
FCT chart tools are categorized into three groups: Advanced Chart, Fast Indicators, and Technical Chart. Each chart category offers unique visualizations to meet various demands by crypto traders. Additionally, the charts page has a side panel, where traders can navigate to read the latest news on crypto and explore Bitcoin (BTC) whale transactions. This way, traders can spot market-moving indicators and reinforce their trading strategies to limit risks and boost returns.
Advanced Chart
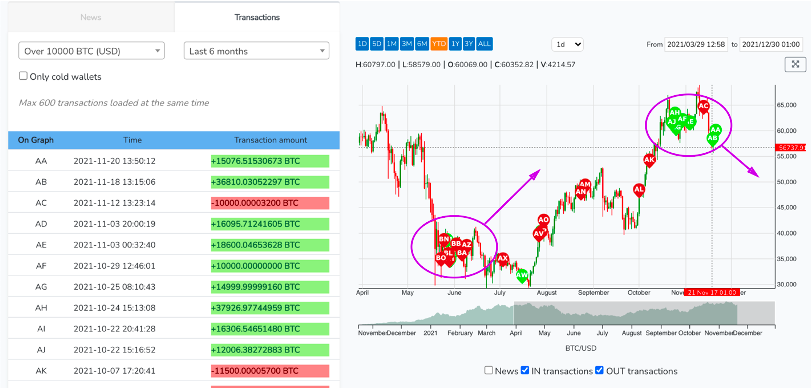
FCT’s most common chart tool is the Advanced Chart. This free-to-access feature democratizes access to powerful trading insights, which users need to grow their portfolio consistently. With the advanced chart, crypto’s headlining news is embedded into the candlestick charts in real-time. So, traders can evaluate the impact of specific news headlines on the crypto market performance. Additionally, traders can deploy the advanced chart to view large transactions (over 1,000 BTC), and the exact times they were settled. This data is further visualized on the graphs to establish the transaction’s impact on the market’s performance.
Using the Advanced Chart
- Check the boxes below the graph to access the news and transactions on the live BTC candlestick graph.
- You can toggle between various time intervals for the candlesticks, from 1 minute to 1 week. To change your preferences, click on the drop-down tab at the top center of the graph.
- To set the period for the information you want to access, select from the 9 options at the top left of the graph, from as recent as 1 day to the all-time market performance.
- Also, access the vital stats for transactions within the period selected including, the highest and lowest prices. Click the tab on the top right of the graph to shift to a full-screen view.
See Other Traders’ Interests
The advanced chart’s news section allows users to react to the news by voting on whether they like it, consider it important, bullish or bearish. So, you can sort the information based on these categories and read what interests you the most.
Other FCT Charts
Another chart category is the Fast Indicator Chart. This chart comprises features for more advanced traders to perform technical analysis and make even more precise decisions. Apart from candlesticks, the graph includes simple moving average (SMA) curves, exponential moving average (EMA) curves, standard deviation (SD), volume, and more.
The Technical Chart is the highest tier of charts, with features for deeper technical analysis of the market.
Finetune Your Trading with FCT Chart Tools
Ready to upgrade your trading? FCT chart tools bring you in-depth visualizations of key stats that will guide you towards more precise trading strategies that grow your portfolio. Sign up for free on the official website and access all tools to make a positive difference in your trade.
If you want to find more about Final Crypto Tool watch the following video for a quick overview of the website tools.
